In short
When someone asks whether a client is up to date, the answer rarely sits in a single system. The contract is in contract management, the invoices in the ERP, the tickets in the helpdesk and the sales history in the CRM. Each system keeps its own records well, and none of them keeps the link to the records in the others. The knowledge graph is the structure that records those links. It is one of the three components of the Company Brain, the layer that knows the company: which data exists, where it lives, how it connects and who can see what.
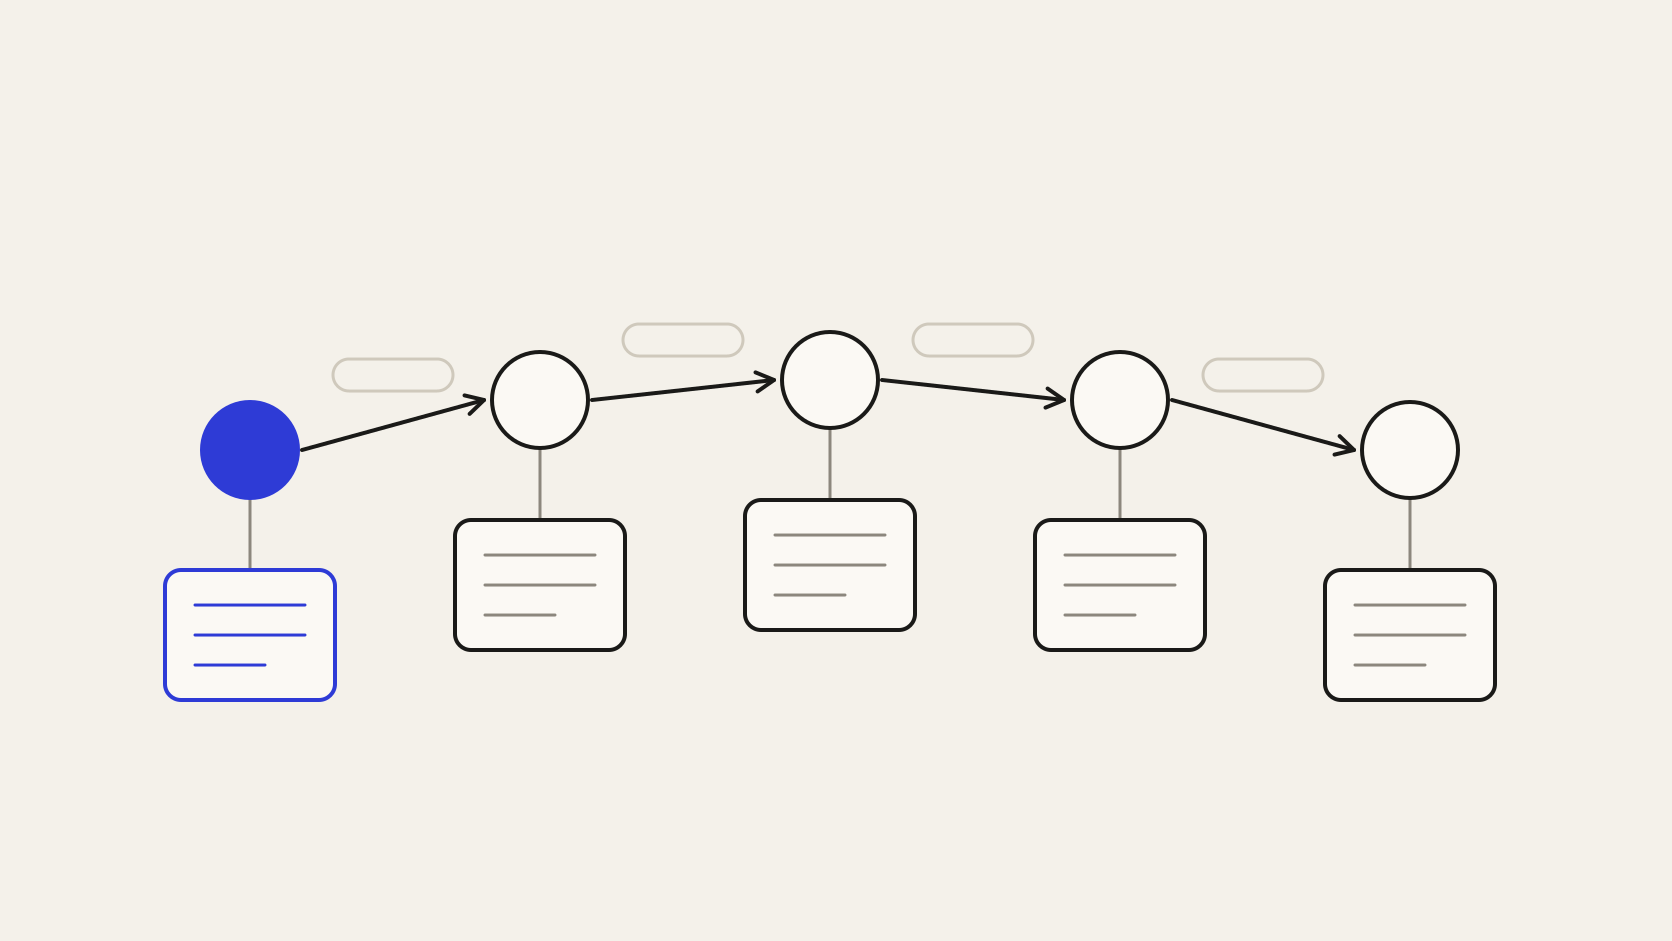
The structure has two elements. Nodes represent the business entities, such as client, contract, order, ticket, product and person. Edges represent the relationships between them, and each relationship has a name: the client signed the contract, the contract originated the order, the order generated the invoice, the client opened the ticket.
Each node carries attributes, such as term, value, status or severity. Edges can carry attributes too, such as the date the relationship began. With that, finding out where a client stands becomes a walk through the relationships that leave that node, instead of a search across four screens.
The concept gained visibility in 2012, when Google introduced the Knowledge Graph as a way to treat searches as real-world things, with more than 500 million objects catalogued in the first version. Some Portuguese translations use a word closer to chart than to graph. In companies, a knowledge graph works at a smaller scale and solves the same problem: understanding which entity a name refers to and which other entities are linked to it.
Relational databases also link records, through foreign keys. The difference is reach. A key links tables inside the same system, and the ERP has no key for the helpdesk ticket or the CRM opportunity. Links between systems usually exist only in the memory of people who know the operation or in reconciliation spreadsheets kept by hand.
The graph also keeps the history of relationships. When a contract is renewed, the previous link stays recorded with its end date, and a question about last year is answered with the relationships that held in that period. Reconciliation spreadsheets rarely preserve this timeline, because each version overwrites the previous one.
The knowledge graph makes these links explicit and queryable. A question such as which clients with a renewal in the next ninety days have a critical ticket open crosses three systems. In a tabular model, it requires joins between databases that were not designed to talk to each other. In the graph, it is a path of two relationships starting from the contracts.
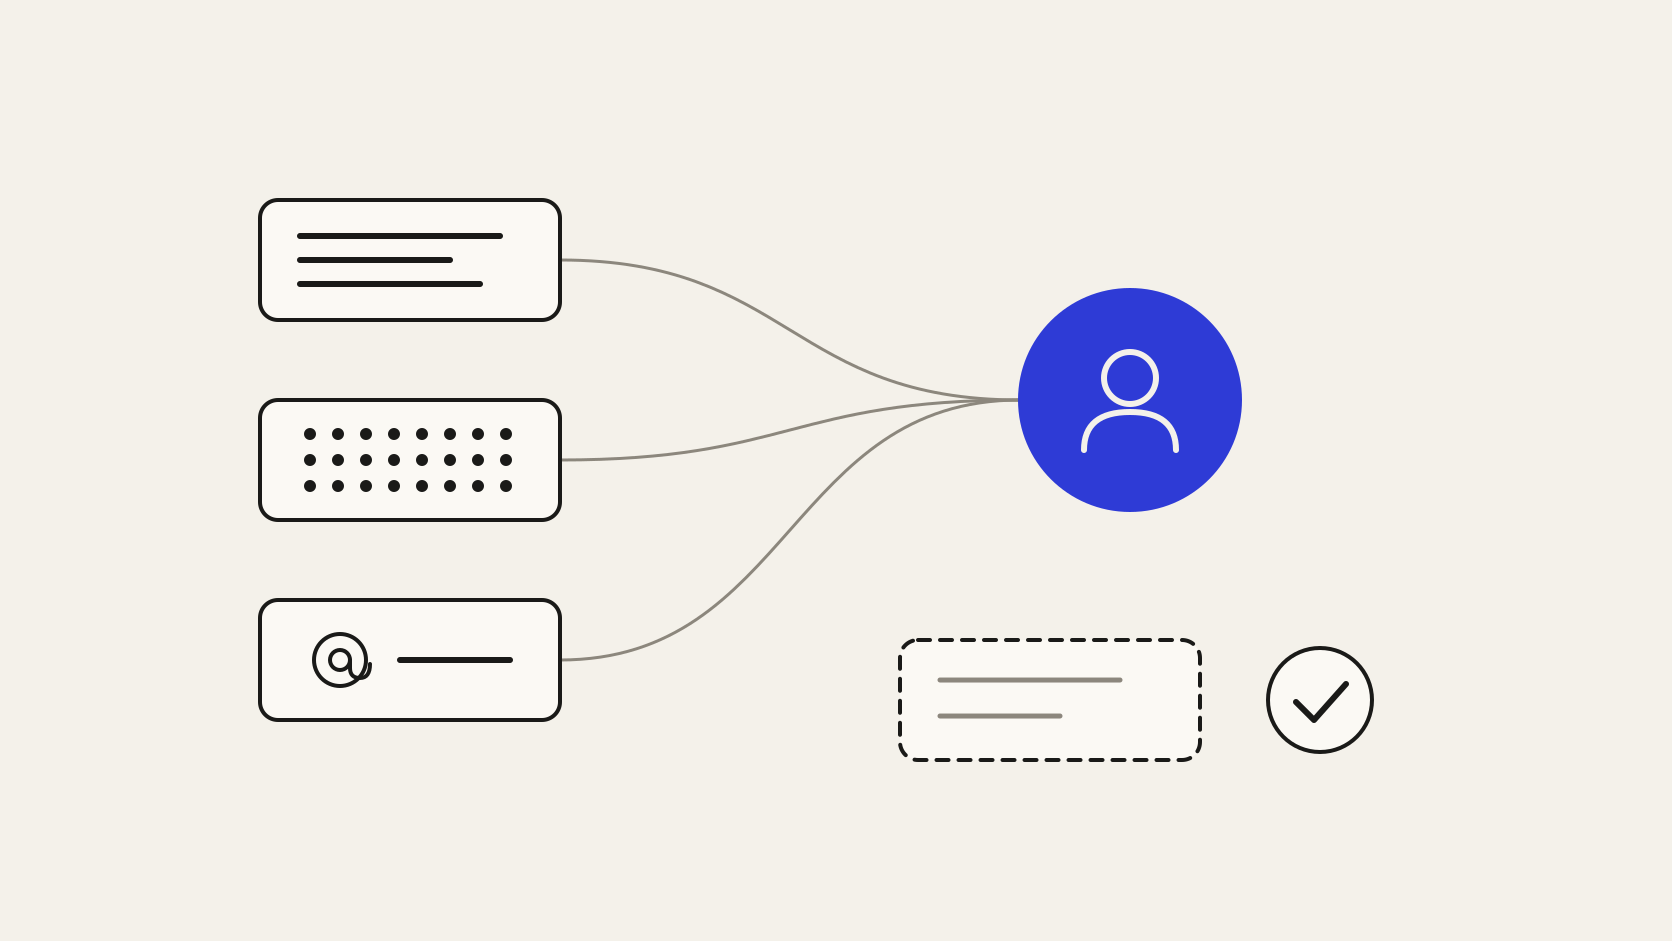
Before linking records, you need to know which records represent the same thing. The same company appears in the CRM under its legal name, in the ERP under its company tax ID (CNPJ) and in the helpdesk under its email domain. The same person may have one record as a sales contact and another as a product user. This work is called entity resolution, which is why the term entity graph also circulates in the market.
Resolution combines deterministic rules, such as the same tax ID, with similarity criteria, such as a similar name and address. Ambiguous cases go to review by someone from the business, because merging two different clients into a single node contaminates every answer that passes through it.
Each link created is recorded with the rule that produced it and the systems involved. When someone asks why two records were treated as the same client, the answer is in the graph itself, and fixing a wrong link carries through to every query that follows.
A language model takes text in and returns text. On its own, it has no way of knowing that a ticket belongs to the same client as the contract that expires next month. When context arrives as loose document excerpts, the model fills the gap with the most likely continuation, and that is where a good share of wrong answers in corporate settings comes from.
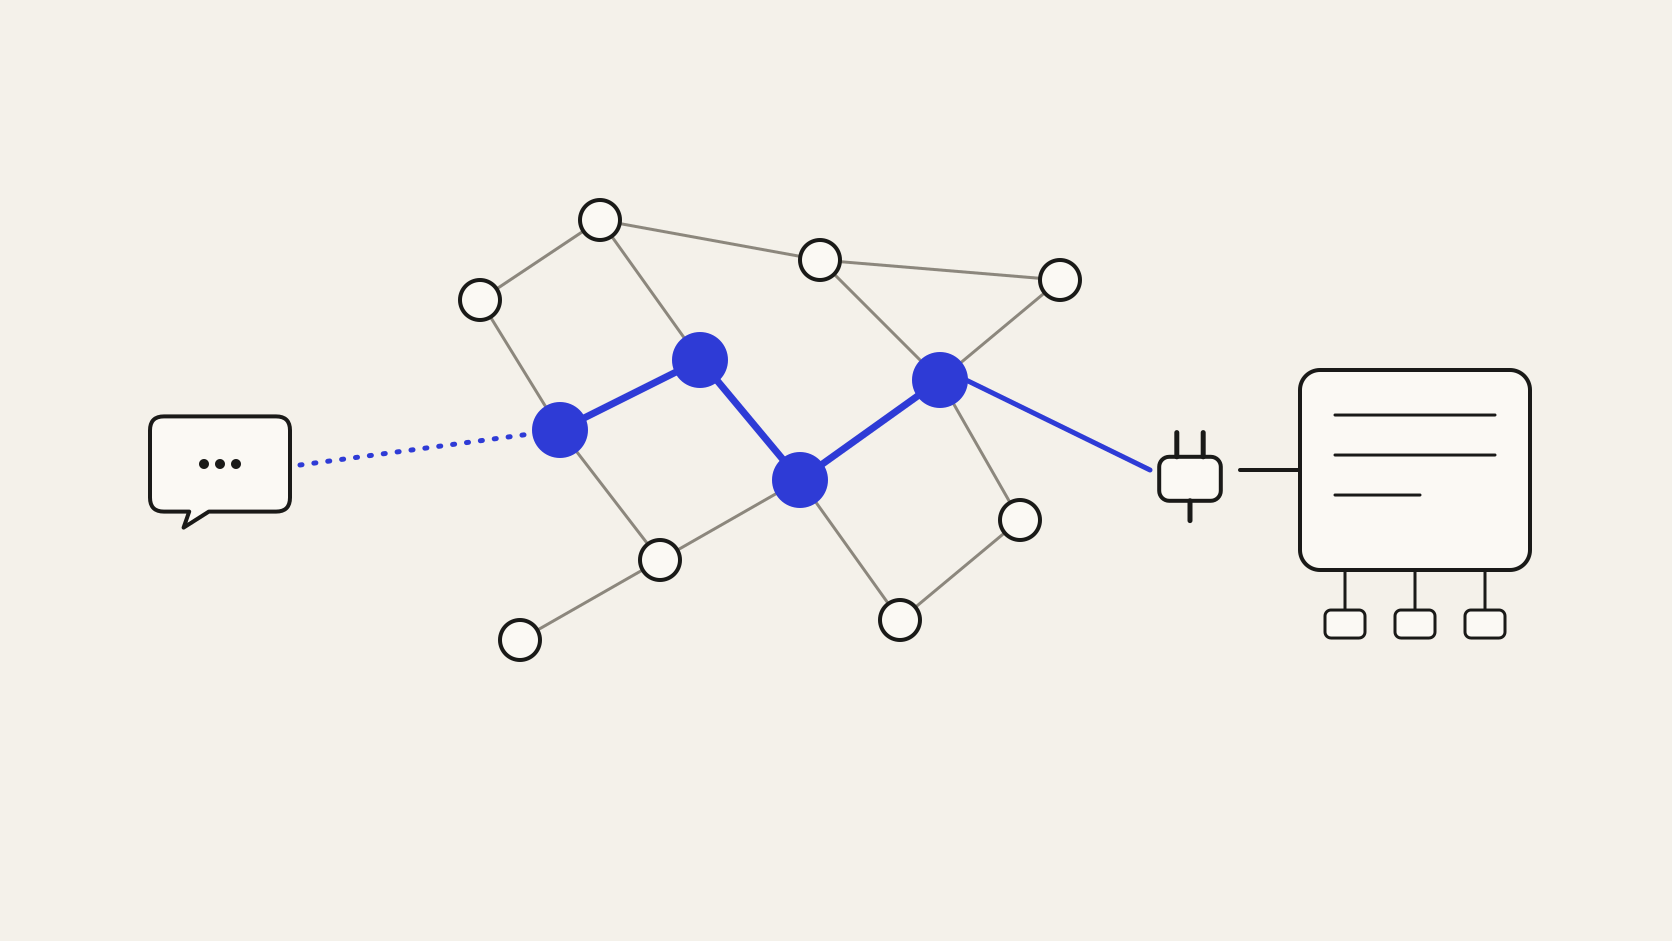
With the knowledge graph, the agent queries the entity and receives the relevant relationships already resolved. In the Company Brain, this slice is served over MCP, the open protocol that connects models to data sources, and each relationship points to the system it came from. The answer gains a verifiable path: this client, through this contract, with these tickets.
A knowledge graph without agreed definitions links records under ambiguous labels. If sales and finance disagree on what an active client is, the active client node carries two truths. That definition is the job of the business ontology, the second component of the Company Brain.
The graph also has to respect who can see what. The relationship between a contract and the negotiated margin matters to the controller's office and should stay restricted to those who already have that access in the ERP. In the Company Brain, permissions are inherited from the source system, and the graph returns to each person only the relationships they can already see.
Modelling the whole company before answering the first question is a common way to stall the project. The recommended starting point is a recurring question that today crosses two or three systems, such as an account briefing before a sales meeting. It defines the first entities, the first relationships and the first sources.
From there, each new use case reuses what has already been modelled and adds only what is missing. The knowledge graph gains value over time because each project starts from the entities and relationships that earlier ones left resolved.